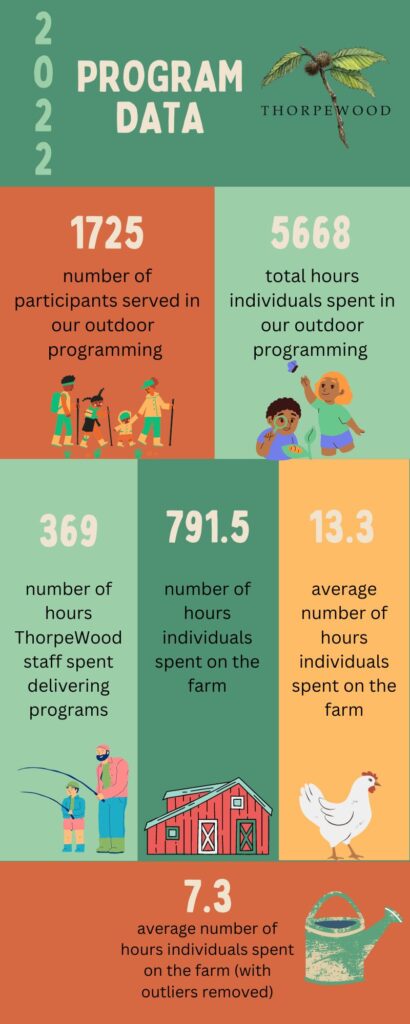
We are proud to report our 2022 program data! Each year, we love to round up our year-end data. Who came to us? How many hours did the spend with us? How many hours did they spend on the farm? How many total hours did we deliver programs? All of this helps to inform us about our year, and also helps us focus in on what matters most. For us, this year we found the number of hours the average program participant spent with us most intriguing. We love our repeat visitors, those who visit us enough to feel like ThorpeWood is a home away from home. As we move into 2023, we are hoping to grow this average hours per participant. We want to serve folks in a deeper way. Let’s check in again on these numbers next year!
Check out our fun infographic that shares all the relevant stats!